


Is organic really better for the environment than conventional (industrial) agriculture?
Our World in Data presents the empirical evidence on global development in entries dedicated to specific topics.
This blog post draws on data and research discussed in our entries on Crop Yields, Land Use, and Fertilizers and Pesticides.
This post was first published on October 19th 2017, and was extended on December 19th 2017.
As the total global population continues to rise and economic growth drives a transition towards more resource-intensive diets, a growing number of consumers are concerned with how to reduce the environmental impact of their dietary choices. Consumers often see organic food as an effective way to reduce their impact: surveys reveal that regardless of geographic location, the primary motivations for organic food purchases are health1 and environmental concerns.2 Furthermore, consumers are often willing to pay more for organic products – some studies indicate a willingness-to-pay of up to 100 percent above standard prices.3 But is this a wise choice? Is going organic really the best way to reduce the environmental impact of our diets?
Before we explore the relative impacts of organic vs. conventional agriculture, it is worth clarifying their definitions. Organic agriculture refers to the farming of crops or livestock without the use of synthetic inputs, including synthetic fertilizers, pesticides, plant growth regulators, nanomaterials and genetically-modified organisms (GMOs).4 Note that organic does not necessitate ‘chemical-free’ or ‘pesticide-free’; chemicals are often used in organic farming, however these cannot be synthetically manufactured, with the exception of a small number which have been approved by the National Organic Standards Board.5 Conventional (sometimes termed ‘industrial’) farming is therefore any agricultural system which uses one or more of the above synthetic inputs.
The methods applied for weed and pest control in conventional and organic systems can also impact on choices of planting and tillage techniques. Conventional farming often utilises synthetic herbicides for the control of weeds; this approach is typically more conducive to low- or no-till management techniques.6 Since herbicide applications cannot be widely adopted in organic farming (with some approved exceptions), options for no-till farming can be more limited and places greater emphasis on approaches such as mechanical controls and/or mulching.
In arable farming (which concerns the production of crops), nutrients can be added to the soil in the form of organic matter, such as green compost, animal manure (human sewage sludge is typically prohibited), or bone meal. For livestock, organic methods mean animals must be fed organically-certified feed (or graze on land with no synthetic chemical inputs), and antibiotics cannot be used throughout their lifetime (except in emergency cases such as disease or infection outbreak). In conventional livestock production, there are no constraints on feed certification and antibiotics or growth hormones are often used. Animal welfare standards for organic certification can vary by country, however for many, livestock must be raised with access to the outdoors (i.e. caged hens are not permitted). Conventional livestock farming covers a range of production methods: they can be produced in either ‘free range’ or ‘caged’ conditions. These are typically monitored and labelled as such on product packaging.
In this post, we present the empirical evidence comparing organic to conventional agriculture in terms of environmental impact. Despite strong public perception of organic agriculture producing better environmental outcomes, we show that conventional agriculture often performs better on environmental measures including land use, greenhouse gas emissions, and pollution of water bodies. There are, however, some contexts where organic agriculture may be considered appropriate.
Organic vs. conventional: what are the relative impacts?
When aiming to provide a comparison of the relative impacts of organic and conventional agriculture, it can often be misleading and misrepresentative to rely on the results of a single comparative study: there will always be single, localised examples where the environmental impacts of a conventional farm are lower than that of a proximate organic farm, and vice versa.7 In order to provide a global and cross-cutting overview of this comparison, Clark and Tilman (2017) published a meta-analysis of results of published organic-conventional comparisons across 742 agricultural systems over 90 unique foods.8
Their analysis reviewed relative impacts across the range of food types – cereals, pulses and oilcrops, fruits, vegetables, dairy and eggs, and meat – and across a range of environmental impact categories – greenhouse gas emissions, land use, acidification potential, eutrophication potential, and energy use. ‘Eutrophication’ refers to the over-enrichment or pollution of surface waters with nutrients such as nitrogen & phosphorous. Although eutrophication can also occur naturally, the runoff of fertilizer and manure from agricultural land is a dominant source of nutrients.9 This disaggregation of food types and environmental impacts is important: there is no reason to suggest that the optimal agricultural system for cereal production is the same as for fruits; and there are often trade-offs in terms of environmental impact – one system can prove better in terms of greenhouse gas emissions but higher in land use, for example.
Food systems are made up of many phases – ranging from pre-farm activities, crop production, animal feed production, and harvesting, to transportation, distribution, and cooking. To fully and consistently account for the various stages of production, a process called life-cycle analysis (LCA) is used. LCAs attempt to quantify the combined impacts across several stages of production by considering all inputs and outputs in the complete process. The key in comparing LCAs between products is ensuring that the same number of stages of the supply chain are included in all analyses. For this meta-analysis, Clark & Tilman (2017) compared 164 LCAs which account for inputs pre-farm and on-farm (up until the food leaves the farm).
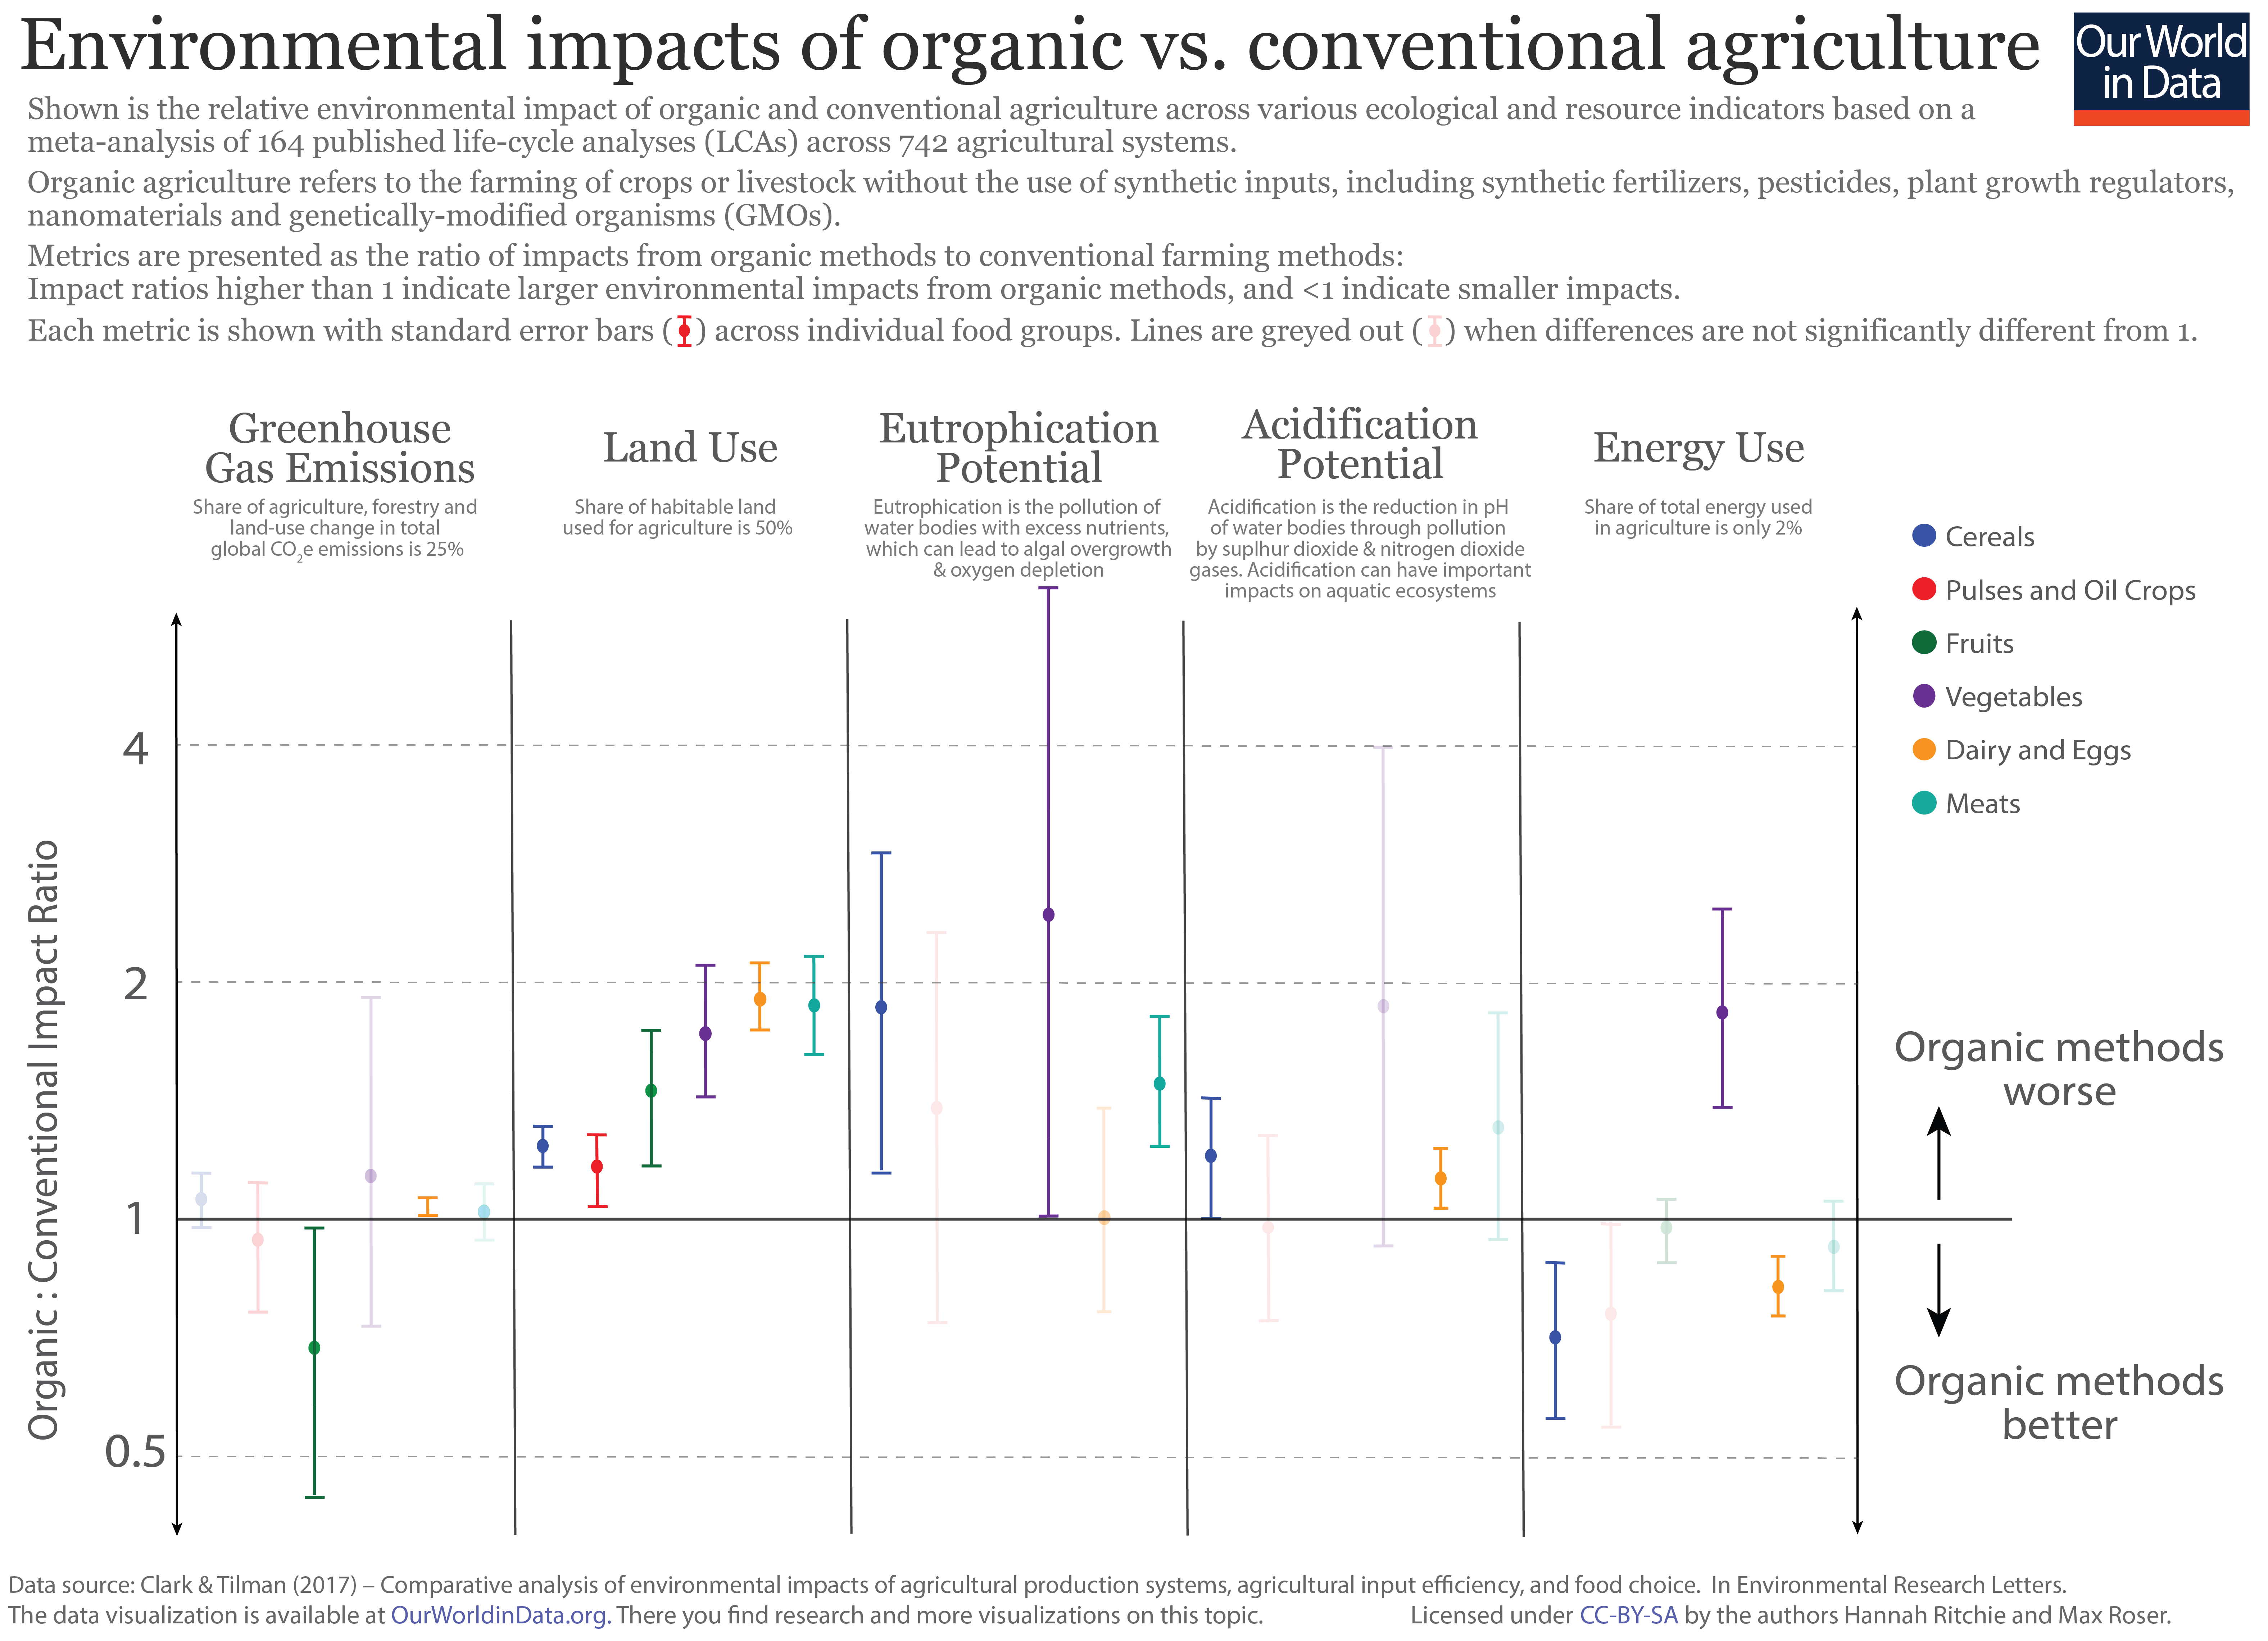
The aggregated results of Clark & Tilman’s study is shown in the chart below. This comparison measures the relative impact ratio of organic to conventional agriculture, whereby a value of 1.0 means the impact of both systems are the same; values greater than 1.0 mean the impacts of organic systems are higher (worse) (for example, a value of 2.0 would mean organic impacts were twice as high as conventional); and values less than 1.0 mean conventional systems are worse (a value of 0.5 means conventional impacts are twice as high). We see these relative impacts measured by food type across our range of environmental impacts with averages and standard error ranges shown.
We see large differences in impact patterns across environmental categories and food types. For some impacts, one system is consistently better than the alternative; whilst for others, results are mixed depending on crop type and the local agricultural context. The clearest results are for land and energy use. Organic systems consistently perform worse in terms of land use, regardless of food type. As we explore in detail in our entry on Yield and Land Use in Agriculture, the world has achieved large gains in productivity and gains in yield over the past half-century in particular, largely as a result of the availability and intensification of inputs such as fertilizer and pesticides. As a result, the majority of conventional systems achieve a significantly higher yield as compared to organic systems. Therefore, to produce the same quantity of food, organic systems require a larger land area.
This produces the inverse result for energy use. The industrial production of chemical inputs such as fertilizers and pesticides is an energy-intensive process. The absence of synthetic chemical inputs in organic systems therefore means that their energy use is predominantly lower than in intensive conventional agriculture. The exception to this result is vegetables, for which energy use in organic systems tends to be higher. Some of this additional energy use is explained by the use of alternative methods of weed and pest control in organic vegetable farming; a technique widely applied as an alternative to synthetic pesticide application is the use of ‘propane-fueled flame weeding’.10 The process of propane production and machinery used in its application can add energy costs – especially for vegetable crops.
Acidification and eutrophication potential are more mixed, but tend to be higher in organic systems; average values across all food types are higher for organic, although there are likely to be some exceptions in particular contexts. Why are organic systems typically worse in these measures? The supply of nutrients in conventional and organic systems are very different; nitrogen supply in conventional agriculture is supplied with the application of synthetic fertilizers, whereas organic farms source their nitrogen from manure application. The timing of nutrient release in these systems is different: fertilizers release nutrients in response to crop demands, meaning nitrogen is released when required by the crops, whereas nitrogen released from manure is more dependent on environmental conditions, such as weather conditions, soil moisture and temperature.
Nutrient-release from manure is therefore not always matched with crop requirements – excess nutrients which are released but not taken up by crops can run off farmland into waterways such as rivers and lakes. As a consequence, the pollution of ecosystems with nutrients from organic farms are often higher than conventional farms, leading to higher eutrophication and acidification potential.
Across all food types, there is no clear winner when it comes to greenhouse gas emissions. Results vary strongly depending on food type, although most lie close to a ratio of one (where differences in impact between the systems are relatively small). Based on average values, we might conclude that to reduce greenhouse gas emissions, we should buy organic pulses and fruits, and conventional cereals, vegetables, and animal products. In general, the greenhouse gas emission sources of organic and conventional systems tend to cancel each other out. Conventional systems produce greenhouse gases through synthetic fertilizer production and application, which is largely balanced by the higher emissions of nitrous oxide (a strong greenhouse gas) from manure application.11
Should we treat environmental impacts equally?
Organic agriculture proves better for some environmental impacts, and conventional agriculture for others. These trade-offs can make it difficult to decide which we should be choosing. But should we be considering all environmental impacts equally? Should some have higher importance than others?
To evaluate these trade-offs we have to consider a key question: how important is agriculture’s contribution to global greenhouse gas emissions, land use, acidification and eutrophication potential, and energy use? Agriculture’s role in land use, greenhouse gas emissions, and energy use is summarised in the three charts below:
- The first chart shows that agriculture, forestry and other land use (AFOLU) is the dominant land user, consuming half of the world’s habitable land;
- The second chart shows that it accounts for approximately one-quarter of greenhouse gas emissions;
- The third chart shows that it accounts for only two percent of energy use;
- The contribution of AFOLU to acidification and eutrophication is more difficult to quantify, however it is widely considered to be the dominant source of nutrient input to aquatic ecosystems.
We might therefore conclude that energy use – the only category in which organic agriculture has a clear advantage – is comparatively substantially less important than other impacts.

Is more intensive agriculture always the answer?
If we are most concerned with areas of environmental change for which agriculture has the largest impact – namely land use, water pollution, and greenhouse gas emissions – for which conventional agriculture tends to be advantaged, is the answer to make global farming as intensive as possible? Not necessarily. There are several reasons why this view is too simplistic.
The impacts quantified here fail to capture another important ecological pressure: biodiversity. Conclusive comparisons of the relative impacts of agricultural systems on biodiversity are still lacking. Biodiversity is affected by a number of agricultural impacts, including pesticide application (which can be toxic to some species), soil erosion, and disruption from land tillage methods, and either habitat destruction or fragmentation.12 Intensive agriculture undoubtedly has severe impacts on local biodiversity.13 A recent study by Hallmann et al. (2017) reports a greater than 75 percent decline in insect populations over the last 27 years; although unclear as to the primary cause of this decline, it’s suggested that pesticide use may be a key contributing factor.14 Organic farming systems also impact biodiversity, but perhaps less dramatically per unit area, due to lower fertilizer and pesticide use. However, as our land-use metrics show: organic agriculture requires far more land than conventional agriculture. This creates a divide in opinion of how best to preserve biodiversity: should we farm intensively over a smaller area (with understanding that biodiversity will be severely affected over this area), or should we farm organically, impacting biodiversity (perhaps less severely) over a much larger area.15 There is no clear consensus on how best to approach this issue.
Another point to consider is that conventional agriculture is not necessarily better across all food types. Context, both in terms of the food commodity and the local environment, can be important. For example, if greenhouse gas reduction is our main focus, we might be best off eating organic pulses and fruits, and conventional cereals, vegetables, and animal products, based on the results presented above.
This leads us to three key conclusions in the organic-conventional farming debate:
- The common perception that organic food is by default better, or is an ideal way to reduce environmental impact is a clear misconception. Across several metrics, organic agriculture actually proves to be more harmful for the world’s environment than conventional agriculture.
- The debate between organic and intensive agriculture advocates is often needlessly polarized. There are scenarios where one system proves better than the other, and vice versa. If I were to advise on where and when to choose one or the other, I’d advise trying to choose organic pulses and fruits, but sticking with non-organic for all other food products (cereals, vegetables, dairy and eggs, and meat).
- The organic-conventional debate often detracts from other aspects of dietary choices which have greater impact. If looking to reduce the environmental impact of your diet, what you eat can be much more influential than how it is produced. The relative difference in land use and greenhouse gas impacts between organic and conventional systems is typically less than a multiple of two. Compare this to the relative differences in impacts between food types where, as shown in the charts below, the difference in land use and greenhouse gas emissions per unit protein between high-impact meats and low-impact crop types can be more than 100-fold. If your primary concern is whether the potato accompanying your steak is conventionally or organically produced, then your focus is arguably misplaced from the decisions which could have the greatest impact.


